So the Swift data is all public. Different people request observations of different supernovae. Sometimes multiple people request data on the same supernova. Other people could have requested data on a particular supernova but it was already being observed. Some of us people spend a lot of time monitoring the observations and modifying the observing plans accordingly. Some of us were involved in getting template observations. Others might have just pulled the public data from the archive and published it. Sometimes there are multiple versions of the photometry independently done and published. With my SOUSA archive, the same data might be tabulated and used by different people. So proper credit is a tricky thing, so here are some of my thoughts.
I recommend citing any papers which originally presented
Swift data on that object and where the data actually comes from (making
clear whether you are using their photometry or your own reduction for
example). For the data available on my website, you should cite the
Swift Optical/Ultraviolet Supernova Archive (SOUSA) paper as the source
< http://adsabs.harvard.edu/abs/2014Ap%26SS.354...89B
>, and the data files usually indicate if there was a previous
publication. If you make extensive use of the UVOT data and/or want advice on
the analysis, it might be appropriate to involve me and add me as a
coauthor. If you are using your own reduction of the data, make sure to indicate the calibration you used (which should be the updated version of Breeveld et al. 2011) and whether they are Vega or AB magnitudes.
If using the SOUSA data, I suggest adding something like this to the observations section:
This supernova was also observed in the UV with the Ultra-Violet/Optical Telescope (UVOT; \citealp{Roming_etal_2005} on the Swift spacecraft \citep{Gehrels_etal_2004}. The UV photometry was obtained from the Swift Optical/Ultraviolet Supernova Archive\footnote{http://swift.gsfc.nasa.gov/docs/swift/sne/swift\_sn.html} (SOUSA; \citealp{Brown_etal_2014}). The reduction is based on that of \citet{Brown_etal_2009}, including subtraction of the host galaxy count rates and uses the
revised UV zeropoints and time-dependent sensitivity from \citet{Breeveld_etal_2011}.
and in the acknowledgements:
The work made use of Swift/UVOT data reduced by P. J. Brown and released in the Swift Optical/Ultraviolet Supernova Archive (SOUSA). SOUSA is supported by NASA's Astrophysics Data Analysis Program through grant NNX13AF35G.
Wednesday, March 4, 2015
Thursday, November 20, 2014
Happy Birthday Swift !!
Ten years ago the Swift satellite was launched into space. In honor of that anniversary I made this montage of one hundred of the supernovae Swift has observed. Here's to ten more years !!

The picture is a mosaic of 100 supernovae and their galaxies observed by Swift. The rendering of Swift is by NASA E/PO, Sonoma State University, Aurore Simonnet
The picture is a mosaic of 100 supernovae and their galaxies observed by Swift. The rendering of Swift is by NASA E/PO, Sonoma State University, Aurore Simonnet
Tuesday, October 7, 2014
SOUSA SCRIPTS
WARNING: these instructions are a work in progress but posted here so I can get feedback from some people. If you try them, please let me know if they work for you, where you need more instruction, etc.
As a part of the Swift Optical/Ultraviolet Supernova Archive (SOUSA) I am reducing and making public as many supernova light curves as I can. In order to be open about my reduction methods and enable others to reduce Swift data on their own, I am posting the scripts that I use to produce light curves of SNe. These scripts could be used to produce light curves of any other single object as well. If you use these scripts in a publication, please cite the SOUSA paper which describes the basic method and put something in the acknowledgements. I haven't extensively tested these scripts on other computers--I use a Macbook Pro 10.6.8 and a newer Macbook Pro. If you have problems or questions, e-mail me or post it in the comments below.
As a part of the Swift Optical/Ultraviolet Supernova Archive (SOUSA) I am reducing and making public as many supernova light curves as I can. In order to be open about my reduction methods and enable others to reduce Swift data on their own, I am posting the scripts that I use to produce light curves of SNe. These scripts could be used to produce light curves of any other single object as well. If you use these scripts in a publication, please cite the SOUSA paper which describes the basic method and put something in the acknowledgements. I haven't extensively tested these scripts on other computers--I use a Macbook Pro 10.6.8 and a newer Macbook Pro. If you have problems or questions, e-mail me or post it in the comments below.
Friday, September 19, 2014
Predicting UV brightness
Here are some plots that may help predict the ultraviolet brightness of a supernova. They are based on the sample and figures from the Swift Optical/Ultraviolet Supernova Archive (SOUSA) paper but focusing on the mid-ultraviolet uvm2 filter. The top plot shows the absolute magnitudes as a function of epoch for a prototype of most SN classes as observed with Swift/UVOT. The right axis shows the redshift limit corresponding to a magnitude of uvm2=20 (a reasonable limit). This could be useful for estimating the redshift range for particular supernova classes for Swift proposals or evaluating the observability of new supernovae now or at later epochs. The bottom plot shows the uvm2-v colors to allow one to estimate the uvm2 magnitude based on a current or predicted optical magnitude, the type and phase. If you use these plots, please cite the SOUSA paper they are based on.

Thursday, August 28, 2014
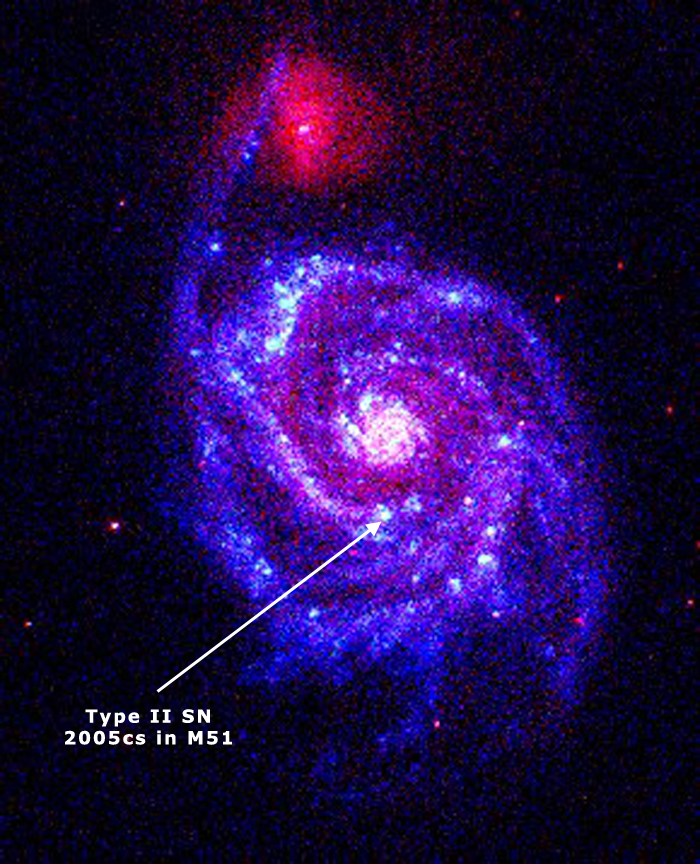
High quality images
Isn't that image beautiful?
When Swift was selected by Popular Science
as one of the best new things in 2005,
my picture even made it into a national magazine.
Wednesday, July 16, 2014
SOUSA: the Swift Optical Ultraviolet Supernova Archive
 Swift
Swift
Optical
Ultraviolet
Supernova
Archive
SOUSA is an archive-in-the-making of all of the Swift supernova data. In its final form, it will contain the images and intermediate photometry products as well as the final photometry. To begin with, we are providing the revised photometry of SNe we've already published onto the updated photometric calibration. More SNe will be updated as we go. The paper describing the photometric reduction will be published in Astrophysics and Space Science and is available on astro-ph.
One use of the data we already have is improving what we do with Swift/UVOT during the rest of its lifetime. Some of the plots in the paper should be useful for proposing new SNe for observation with Swift or preparing Guest Investigator proposals. For example, the plot below gives a rough idea of the brightness of SNe in the mid-ultraviolet. This allows one to estimate the distance to which one could detect a SN down to a given limiting magnitude. The right axis of the plot gives the distance modulus for a limiting magnitude of uvm2=20.


The limiting magnitude UVOT reaches is a function of the exposure time and the brightness of the underlying galaxy (due to our conservative method of subtracting the galaxy flux and propagating its uncertainty into the final photometry and limits). For low contamination, 1000 seconds will reach a limiting magnitude of 20. Based on the exposure time ratios for the preferred UVOT mode 0x223f, 3000 seconds of exposure are needed for the full 6 filters.

This
plot shows the color and absolute magnitude evolution for a well
observed supernova of most subclasses. This could be used to estimate
the class and/or epoch of a SN with UV/optical photometry. The plots
could also be helpful in planning what epochs could be reached to a
given limiting magnitude.
Tuesday, April 15, 2014
Swift Supernova photometry version B14.1.dat format
I've made a new version of my UVOT supernova photometry code, I think fixing the upper limit issues with version 13.2 and fixing some overestimated errors when doing aperture corrections. Before going through all the supernovae (yet again!) I would like to finalize the final output format that will be used by others. Fits tables can be shared which provide all the nitty gritty details of source counts, coincidence loss correction factors, and such, but I would like these data text files to contain 90% of what anyone else would want. Below is a sample for SN2005cf. Suggests are welcome, especially if other columns would be useful outputs.
################
# SN2005cf magnitudes from Swift UVOT
# generated Mon Mar 31 22:35:16 CDT 2014 using version 2014.1
# of Peter Brown's photometry pipeline
# and version Swift_Rel4.2(Bld31)_25Nov2013 of HEASOFT
#
# Data comes from the Swift Data Center
# A 5 arcsec aperture is used to measure the counts for the coincidence loss correction,
# a 3 or 5 arcsec source aperture (based on the error) was used for the aperture photometry
# subtracting off the galaxy count rate in a template image (if available),
# and applying an aperture correction as appropriate (based on average psf in Swift CALDB)
# and zeropoints from Breeveld et al. (2011) which update Poole et al. (2008)
# including a time-dependent sensitivity loss
# to put the magnitudes on the UVOT photometric system described in that paper.
#
# Brown, P. J., Holland, S. T., Immler, S., et al. 2009, ApJ, 137, 4517
# Brown, P. J., et al. 2014, Ap\&SS
# Breeveld, A. A., Landsman, W., Holland, S. T., et al. 2011, in AIP Conf. Proc. 1358,
# Gamma-Ray Bursts 2010, ed. J. E. McEnergy, J. L. Racusin, & N. Gehrels
# (Melville, NY: AIP), 373; arXiv:1102.4717
# Poole, T. S., Breeveld, A. A., Page, M. J., et al. 2008, MNRAS, 383, 627
#
#
# Original reference for Swift observations:
# Wang, X., et al. 2009, ApJ, 697, 380
# The data have been reanalyzed with the revised zeropoints
# and sensitivity corrections of Breeveld et al. 2011.
# Use of this final version should also reference Brown et al. 2014, Ap\%SS, submitted
#
# The underlying galaxy had the following count rates
# in a 5 arcsec aperture at the source position
# (missing filters list 0 but used a background region similar to the SN ):
# Galaxy count rates in 5" aperture
# V 0.202 0.127865
# B 0.101 0.194355
# U 0.205 0.0936644
# UVW1 0.052 0.0255154
# UVM2 0.029 0.00996702
# UVW2 0.005 0.0109126
#
# There are no known issues with this photometry.
# b and v data consistent with BV data from
# Pastorello et al. 2007, MNRAS, 376, 1301 S corrected mags
# S corrected mags from Wang et al. 2009, ApJ, 697, 380
# MJD Mag MagErr 3SigMagLimit 0.98SatLimit Rate RateErr ApSize Exposure DateObs Tstart Tstop
#
# uvw2
53525.0428 17.794 0.114 20.315 11.085 0.683 0.072 3.000 283.226 2005-06-04T00:59:12 139539551.990120 139539839.754778
#
# uvm2
53525.0466 NULL NULL 19.679 10.555 0.044 0.021 3.000 212.361 2005-06-04T01:05:21 139539920.975120 139540136.738778
################
The final format is now:
# Filter MJD[days] Mag MagErr 3SigMagLim 0.98SatLim[mag] Rate[c/s] RateErr[c/s] Ap[arcsec] Frametime[s] Exp[s] Telapse[s]
#
UVW2 53525.0428 17.794 0.114 20.315 11.085 0.683 0.1 3.000 0.0110322 283.23 287.76
################
# SN2005cf magnitudes from Swift UVOT
# generated Mon Mar 31 22:35:16 CDT 2014 using version 2014.1
# of Peter Brown's photometry pipeline
# and version Swift_Rel4.2(Bld31)_25Nov2013 of HEASOFT
#
# Data comes from the Swift Data Center
# A 5 arcsec aperture is used to measure the counts for the coincidence loss correction,
# a 3 or 5 arcsec source aperture (based on the error) was used for the aperture photometry
# subtracting off the galaxy count rate in a template image (if available),
# and applying an aperture correction as appropriate (based on average psf in Swift CALDB)
# and zeropoints from Breeveld et al. (2011) which update Poole et al. (2008)
# including a time-dependent sensitivity loss
# to put the magnitudes on the UVOT photometric system described in that paper.
#
# Brown, P. J., Holland, S. T., Immler, S., et al. 2009, ApJ, 137, 4517
# Brown, P. J., et al. 2014, Ap\&SS
# Breeveld, A. A., Landsman, W., Holland, S. T., et al. 2011, in AIP Conf. Proc. 1358,
# Gamma-Ray Bursts 2010, ed. J. E. McEnergy, J. L. Racusin, & N. Gehrels
# (Melville, NY: AIP), 373; arXiv:1102.4717
# Poole, T. S., Breeveld, A. A., Page, M. J., et al. 2008, MNRAS, 383, 627
#
#
# Original reference for Swift observations:
# Wang, X., et al. 2009, ApJ, 697, 380
# The data have been reanalyzed with the revised zeropoints
# and sensitivity corrections of Breeveld et al. 2011.
# Use of this final version should also reference Brown et al. 2014, Ap\%SS, submitted
#
# The underlying galaxy had the following count rates
# in a 5 arcsec aperture at the source position
# (missing filters list 0 but used a background region similar to the SN ):
# Galaxy count rates in 5" aperture
# V 0.202 0.127865
# B 0.101 0.194355
# U 0.205 0.0936644
# UVW1 0.052 0.0255154
# UVM2 0.029 0.00996702
# UVW2 0.005 0.0109126
#
# There are no known issues with this photometry.
# b and v data consistent with BV data from
# Pastorello et al. 2007, MNRAS, 376, 1301 S corrected mags
# S corrected mags from Wang et al. 2009, ApJ, 697, 380
# MJD Mag MagErr 3SigMagLimit 0.98SatLimit Rate RateErr ApSize Exposure DateObs Tstart Tstop
#
# uvw2
53525.0428 17.794 0.114 20.315 11.085 0.683 0.072 3.000 283.226 2005-06-04T00:59:12 139539551.990120 139539839.754778
#
# uvm2
53525.0466 NULL NULL 19.679 10.555 0.044 0.021 3.000 212.361 2005-06-04T01:05:21 139539920.975120 139540136.738778
################
The final format is now:
# Filter MJD[days] Mag MagErr 3SigMagLim 0.98SatLim[mag] Rate[c/s] RateErr[c/s] Ap[arcsec] Frametime[s] Exp[s] Telapse[s]
#
UVW2 53525.0428 17.794 0.114 20.315 11.085 0.683 0.1 3.000 0.0110322 283.23 287.76
Subscribe to:
Comments (Atom)